Finding Performance Issues with Lighthouse Audit: A Developer's Guide
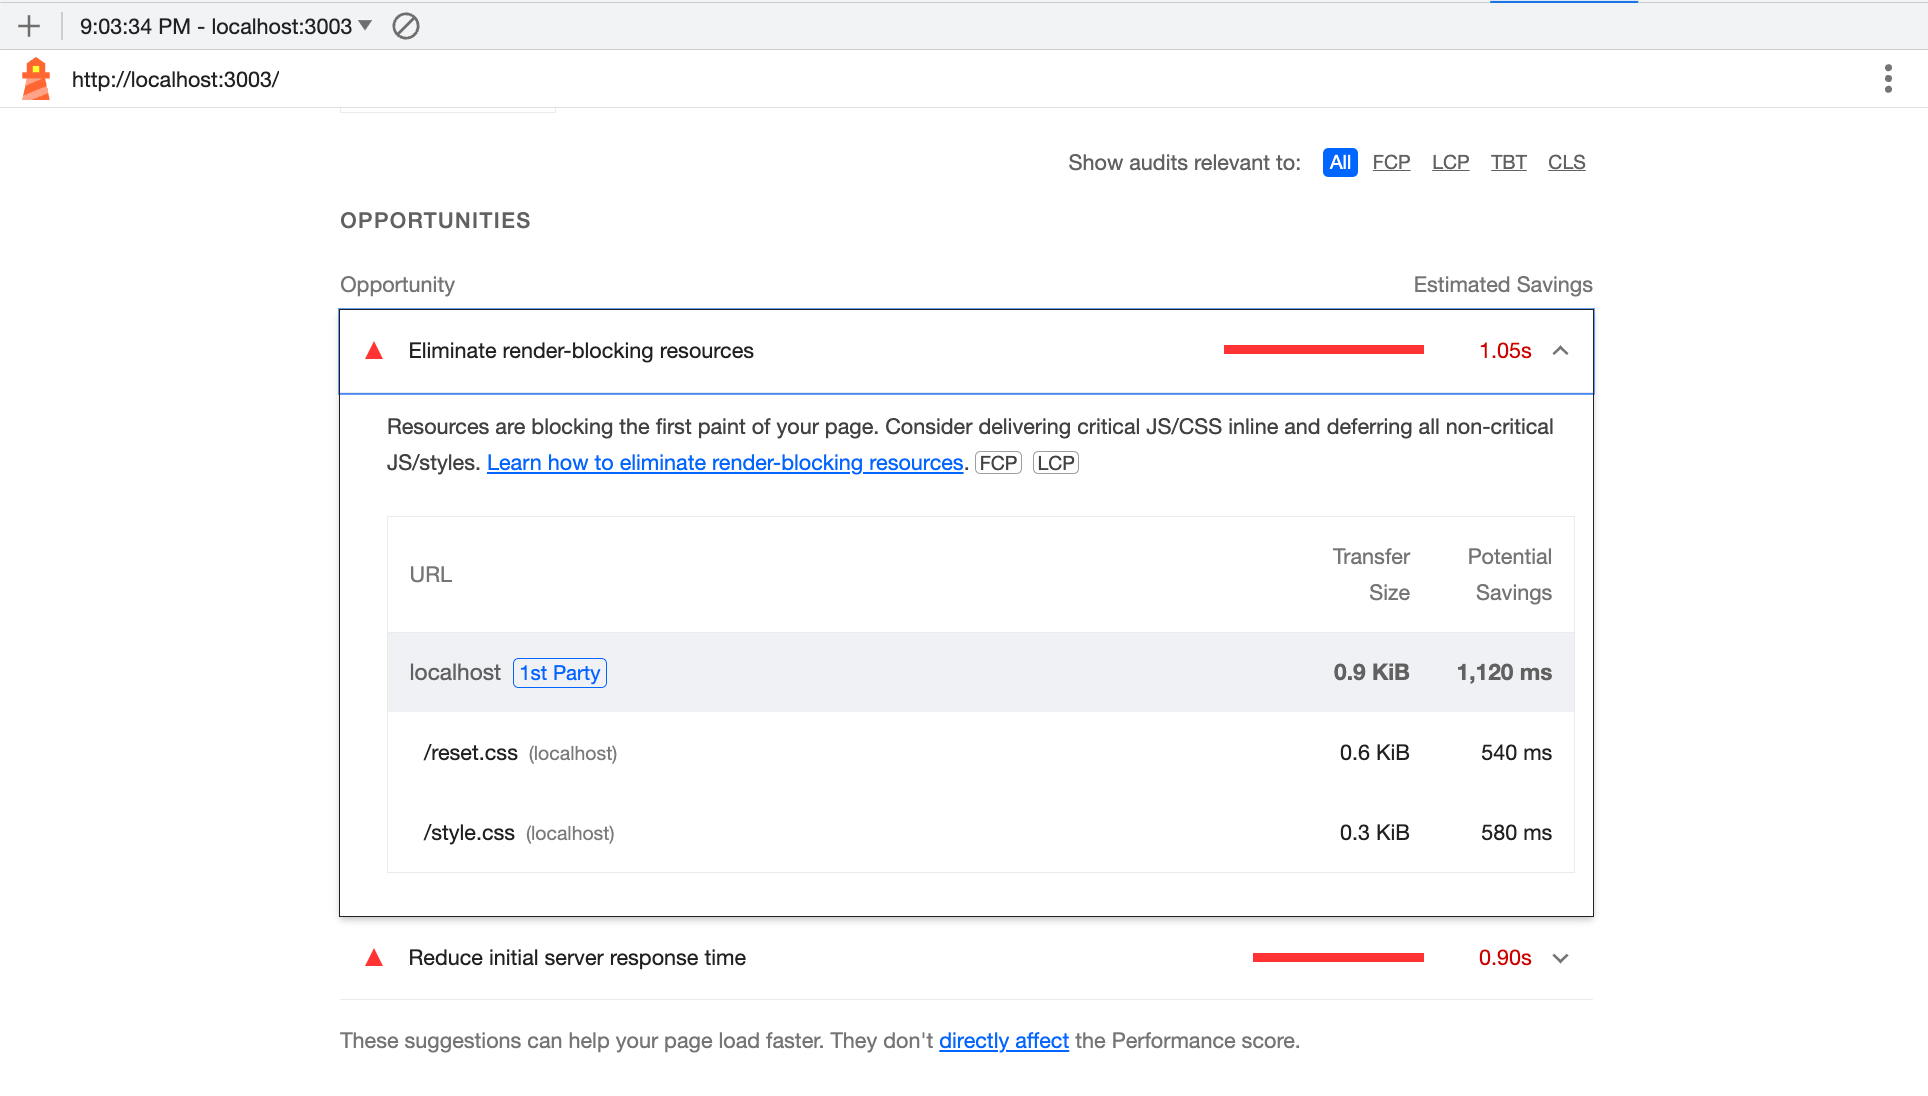
Web performance Core Web Vitals INP Lighthouse DevtoolsLighthouse is an automated tool integrated into browser DevTools. Using Lighthouse, you can conduct various audits of any website, including performance, accessibility, SEO, and best practices. It also provides a detailed report of the Core Web Vitals, enabling developers to assess the health score of any website. In most cases, Lighthouse offers suggestions to improve the website’s performance.

Let's understand why these audits are important: #
Performance: Your site’s speed is one of the key factors that can make or break user engagement. Lighthouse dives deep into various performance metrics and core web vitals, providing you with a detailed report that reflects your website's loading time, responsiveness, and overall user experience.
Accessibility: In today's inclusive digital world, ensuring that your website is accessible to everyone, including individuals with disabilities, is not just ethical; it's essential. Lighthouse helps identify accessibility issues, guiding you on how to make your website more usable for all visitors.
SEO (Search Engine Optimization): A well-optimized website is crucial for being discovered in search engine results. Lighthouse evaluates important SEO factors and gives you actionable insights to improve your site's visibility to search engines, ensuring you're not lost in the digital crowd.
Best Practices: The digital realm is ever-changing, and adhering to best practices is vital for maintaining a robust online presence. Lighthouse provides suggestions based on industry standards, helping you stay ahead of the curve.
How to access lighthouse #
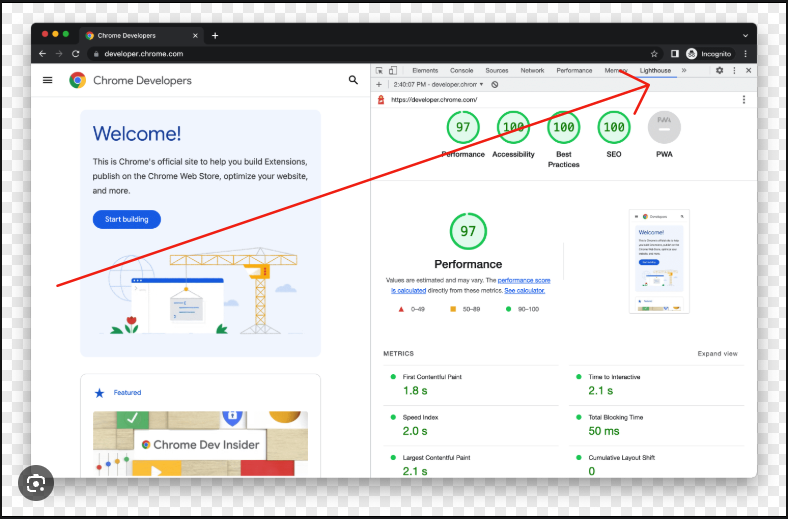
You can access lighthouse by going to the browser devtools.
Open DevTools using cmd + option + i (Mac) or ctrl + shift + i (Windows/Linux). Navigate to the "Lighthouse" tab in the DevTools panel. If you don't see it immediately, click the "More panels" button (>>) to find it.

Running an audit using Lighthouse #
Before running an audit, you can choose between different emulators:
Mobile Emulation #
By default, Lighthouse runs the audit simulating a mobile device. This uses:
- A mobile viewport size
- Mobile CPU throttling
- Mobile network conditions (4G)
- Touch-based interaction mode
Desktop Mode #
You can switch to desktop mode which uses:
- A larger viewport size
- No CPU throttling
- Better network conditions
- Mouse-based interaction mode
Select the appropriate mode based on your target audience. If your website primarily serves mobile users, stick with the mobile emulation. For desktop-focused applications, use the desktop mode.

Now there are different modes we can choose
Navigation
Navigation mode analyzes a single page load, making it ideal for traditional web pages where users navigate from one URL to another. This mode captures essential metrics like First Contentful Paint (FCP), Largest Contentful Paint (LCP), and Time to Interactive (TTI). It's the most commonly used mode for general performance auditing, providing comprehensive insights into the page's loading performance.
Timespan
Timespan mode allows you to measure performance over a custom period of time. This mode is particularly useful for Single Page Applications (SPAs) or pages with significant user interactions. It continuously records metrics while users interact with the page, making it ideal for identifying memory leaks or performance degradation during usage. Additionally, timespan mode excels at analyzing client-side routing behaviors and how dynamic content loading affects performance.
Snapshot
Snapshot mode provides a detailed analysis of your page's current state at a specific moment. Unlike navigation or timespan modes, it doesn't measure loading performance or user interactions. Instead, it focuses on examining the static aspects of your page, such as DOM structure, accessibility features, SEO elements, and compliance with best practices. This mode is particularly valuable when you need to assess your page's accessibility standards, validate SEO implementations, or check Progressive Web App (PWA) requirements.
Selecting categories for the audit #
Before running the audit, you need to select which categories you want to analyze. Lighthouse offers several categories:
- Performance: Analyzes loading speed, responsiveness, and visual stability
- Accessibility: Checks for WCAG compliance and usability features
- Best Practices: Examines modern web development standards
- SEO: Evaluates search engine optimization factors
- Progressive Web App: Tests PWA compatibility and features

Once you've selected your categories, click "Analyze page load" to start the audit. Lighthouse will then generate a comprehensive report based on your selections.
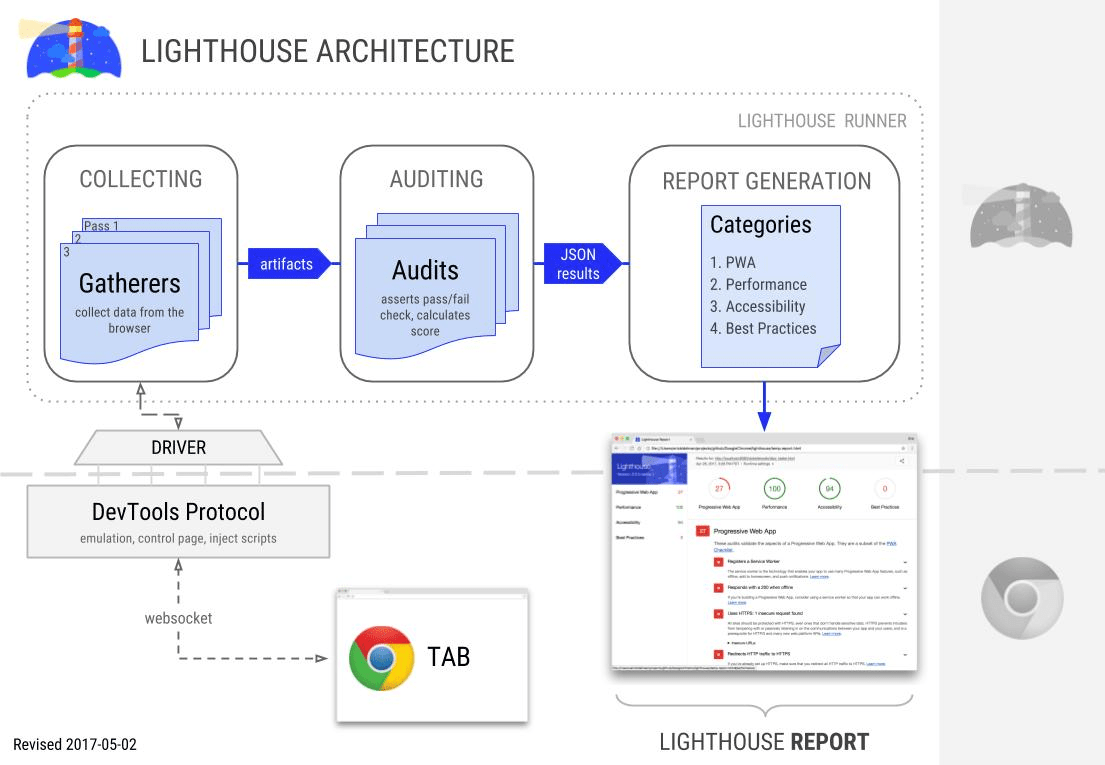
If you want to know how lighthouse run and collect the report, you can check the lighthouse architecture from here

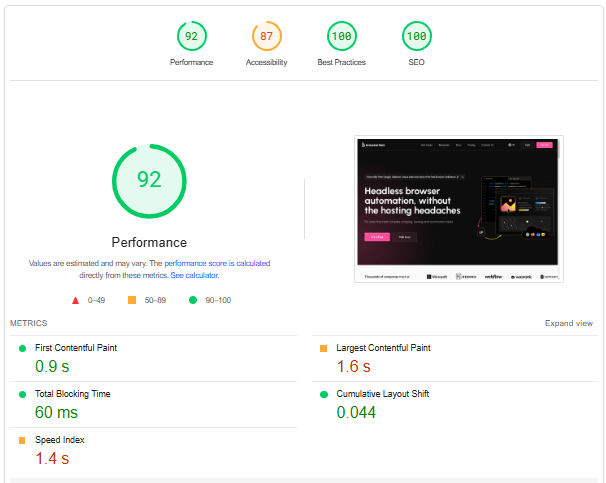
Now the result will be generated for each of the items like this #

Reading the lighthouse results #
Lighthouse results show Core Web Vitals as part of its performance metrics section. Here's how they appear:
Largest Contentful Paint (LCP)
Shows timing for the largest content element to become visible
Good: < 2.5s
Needs Improvement: 2.5s to 4s
Poor: > 4s
First Input Delay (FID)
Measures interactivity/responsiveness
Good: < 100ms
Needs Improvement: 100ms to 300ms
Poor: > 300ms
Cumulative Layout Shift (CLS)
Measures visual stability
Good: < 0.1
Needs Improvement: 0.1 to 0.25
Poor: > 0.25
